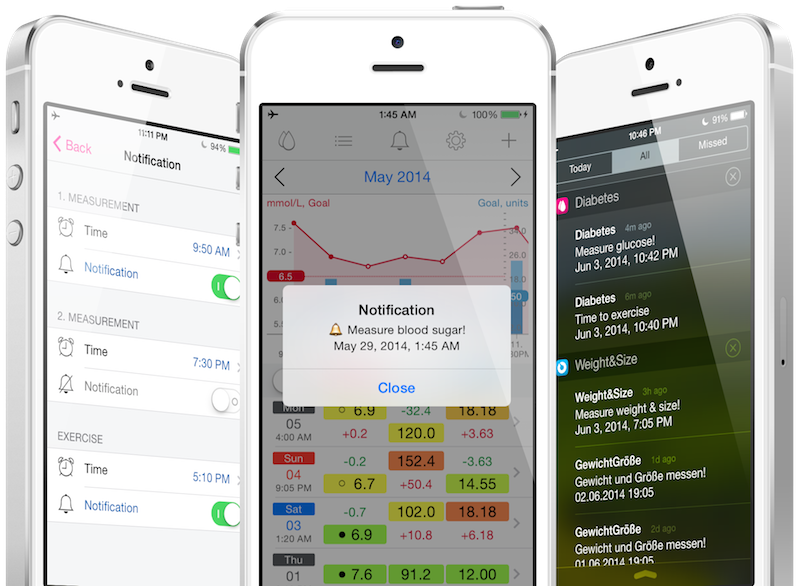
History List
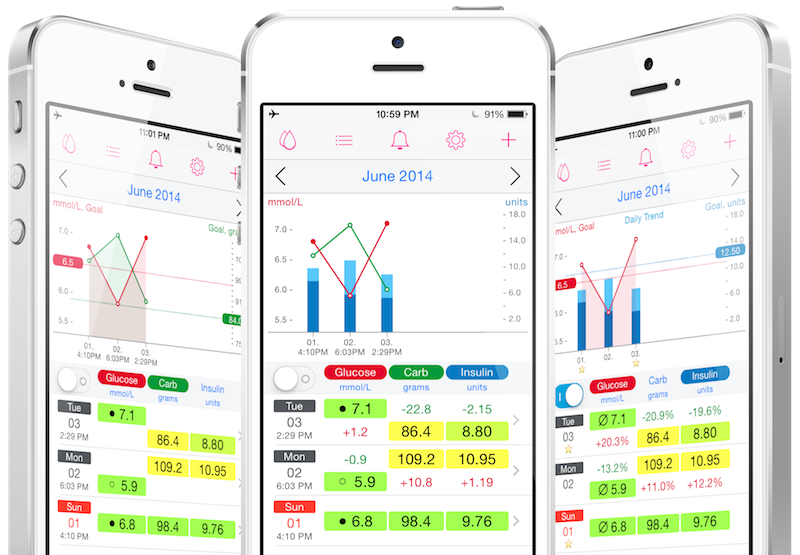
show difference
Difference of measurement values are shown in value, percent or none (configurable in the setting).
3 height positions in the row show the changing status of measurement values: higher, equal or lower than the previous value.
Background color of each measurement value shows the diabetes diagnostic criteria.
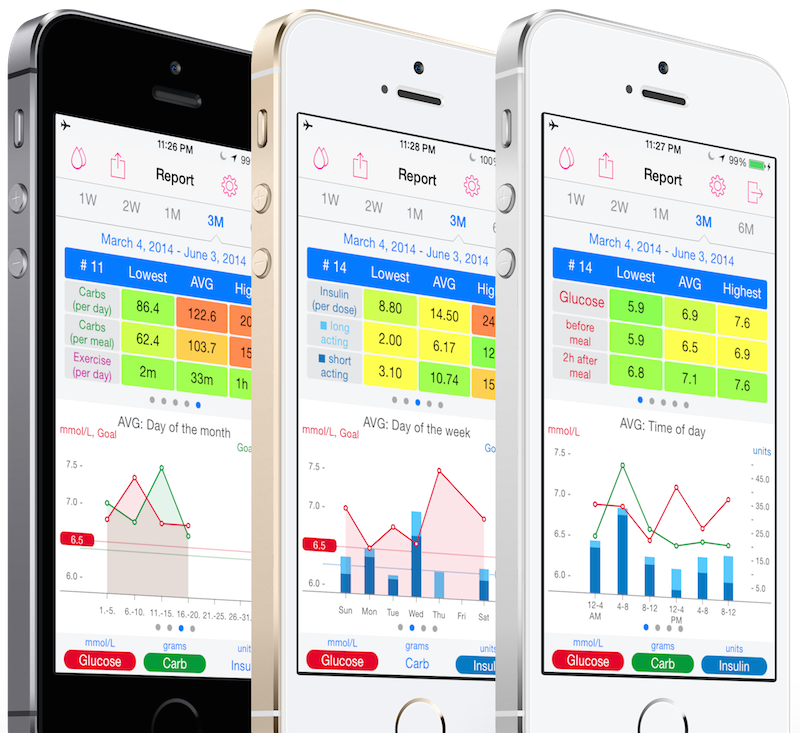
History view is changeable between the list only and the list with diagram.