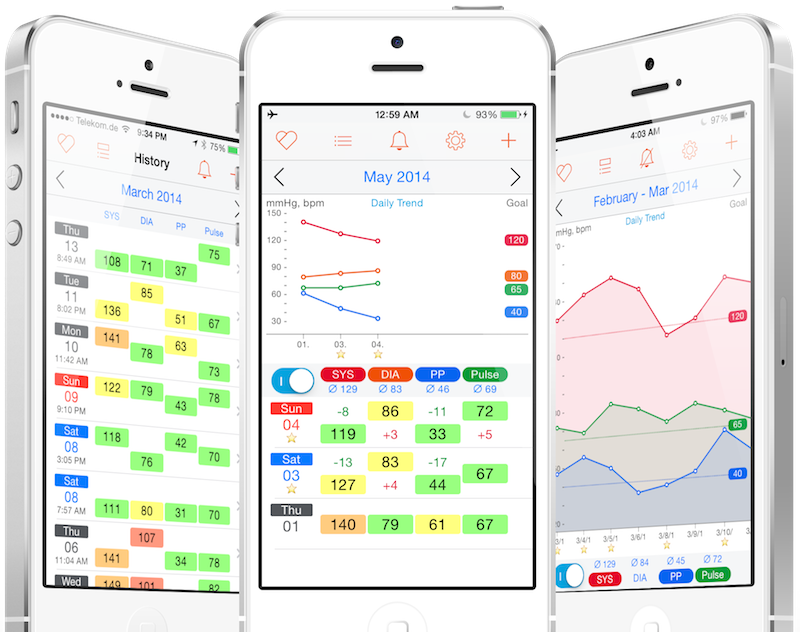
Blood Pressure Passport

History List

show difference

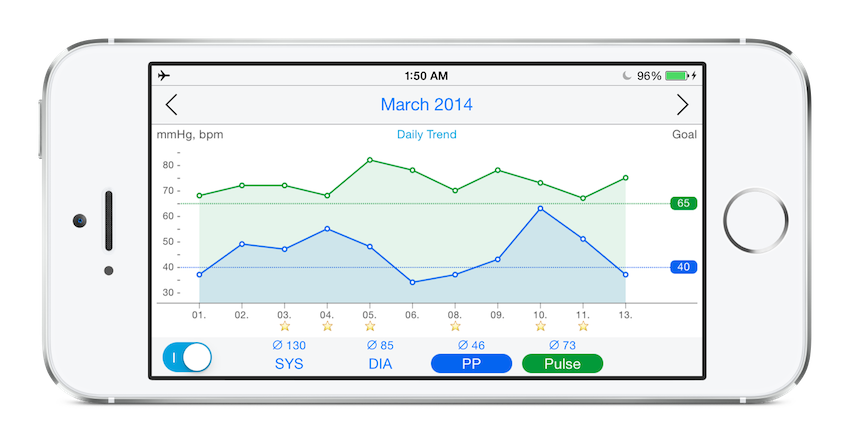
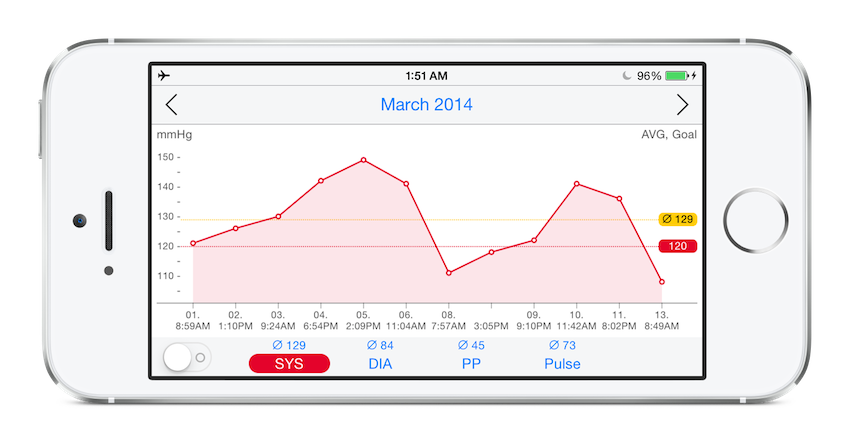
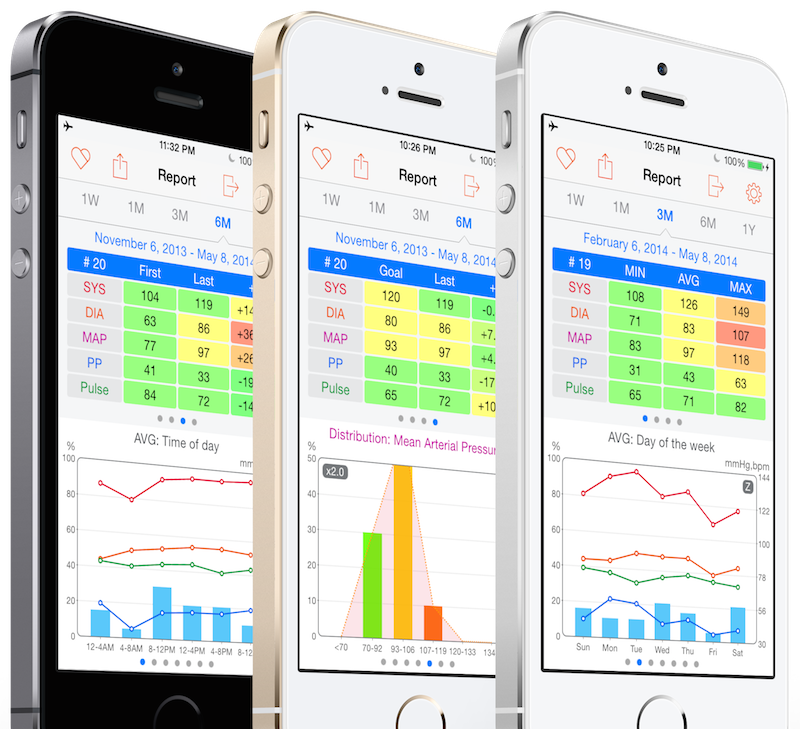
History view is switchable between daily trend list in 2 monthes period and all records list in a month period.
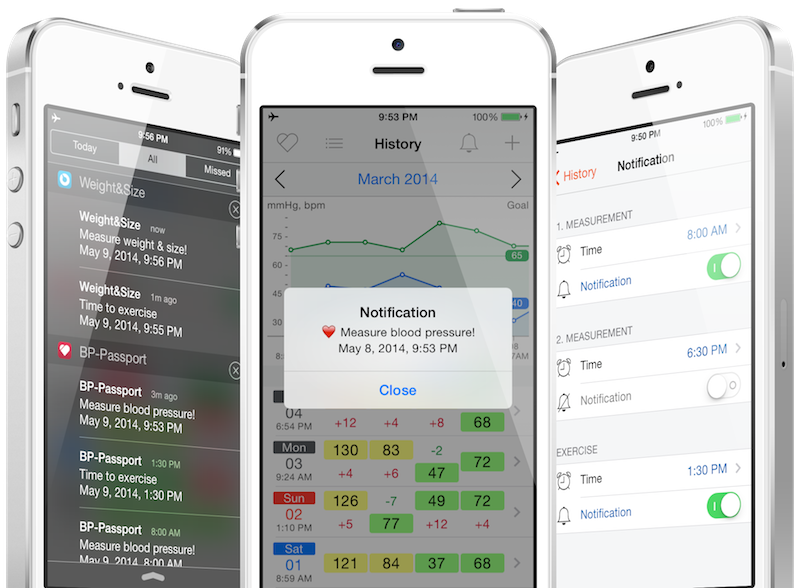
Difference of measurement values are shown in value, percent or none (configurable in the setting).
3 height positions in the row show the changing status of measurement values: higher, equal or lower than the previous value.
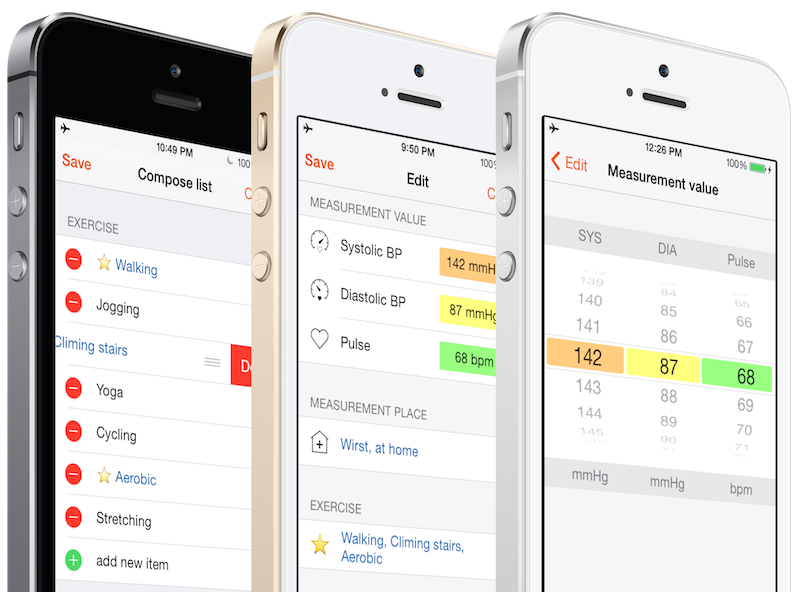
Background color of each measurement value shows the hypotension category.
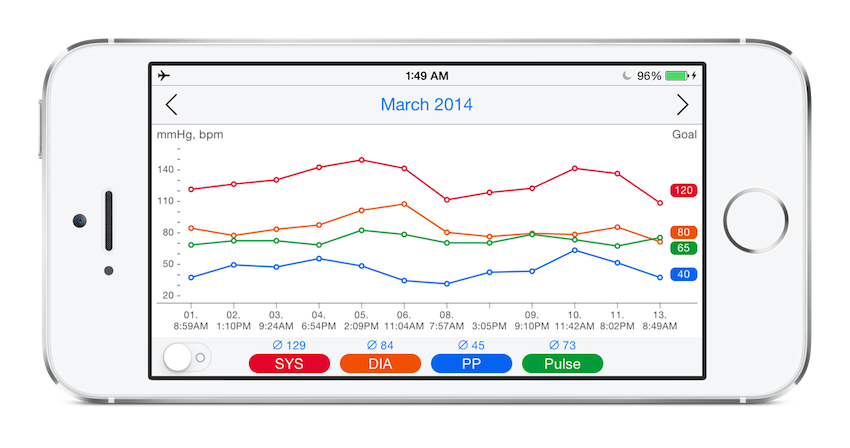
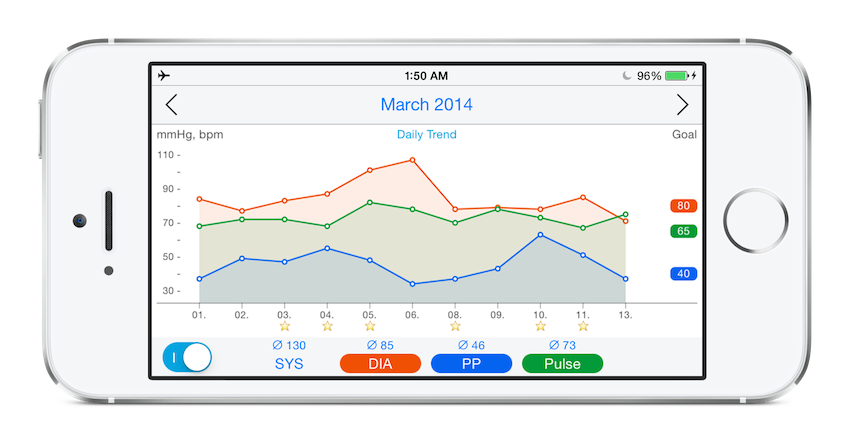
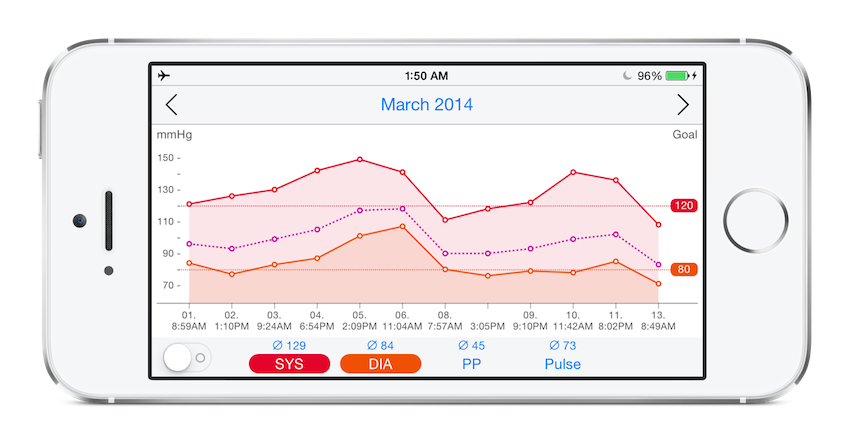
History view is changeable between the list only, the list with diagram and the full screen diagram (swipe down on the graph).

History List

Trend Graphic

show variety

A small diagram with 4 switch-buttons (SYS, DIA, PP, Pulse) on the portraits mode can be transformed to a large diagram on landscape mode.

Create 15 beautiful diagrams by combining the 4 switch-buttons (SYS, DIA, PP, Pulse) on portraits and landscape mode.

Edit Mask

show simplicity

SYS, DIA and Pulse in the same Picker.
Customizable measurement places and exercise types.
Freetext note

Edit Mask

Daily Reminder

show comfort

Daily local notification in 2 different measurement times and exercise time which can be separately switchable with on/off-button.

Daily Reminder

Statistics

show evaluation

Statistics by last week, 1/3/6 months or year.
Minimum, average, maximum, first, last and goal values in 4 matrix-tables.
Average in day time / weekday and distributions in 7 diagrams with zoom view (double-tap on the diagram).

Editable information links: tap on the labels (SYS, DIA, MAP, PP, Pulse) in the matrix-table.

Statistics

Report & Export

show usefulness

Beautiful PDF report with statistics, diagrams and measurement logs.

Supports Preview, AirPrint (printing in app), AirDrop and E-mail of PDF report and CSV-Export.

Report & Export
Blood Pressure Passport